Meteorological observations for Europe from ECAD
Topics
- Access
- Description
- Parameters
- Coverage, spatial and temporal resolution
- Data quality
- Contact person
- References
- Data citation
Access
UNRESTRICTED:
RESTRICTED:This link to the data set is only available for a restricted user group. The data set is only accessible in CEN/MPI net or accessible from external nets with a customer account. Please contact ICDC if you would like to access this data from outside the network.
- Access ECAD data via HTTP/OPeNDAP
- Data access via file system: /data/icdc/atmosphere/ecad_eobs
Description
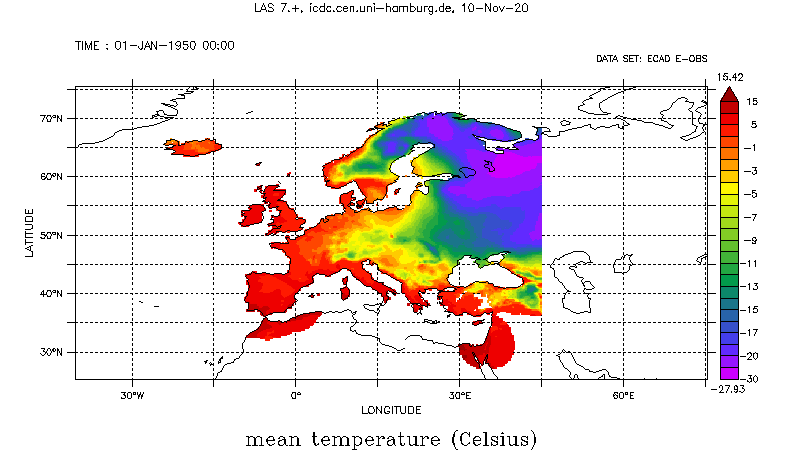
ECAD is the acronym for European Climate Assessment & Data set, which is a daily, high-resolution data set of in-situ meteorological observations within Europe gridded into geographic projection. The observations comprise surface pressure, 2-m air temperature (mean, minimum, maximum), relative humidity, wind speed, downwelling shortwave radiation, and precipitation and are from, in the mean time, over 3700 (for temperature) and over 9000 (for precipitation) observation stations.
Information about ECAD, the interpolation methods used and the approach to estimate the uncertainties are given in the references and on the ECAD web page.
We offer version 31e of the ECAD data set (except surface pressure, which is still version 30e).
Last update of this data set at ICDC: June 19 2025.
Parameters
| Name | Einheit |
|---|---|
| Mean 2-m air temperatur | °C |
| Maximum 2-m air temperatur | °C |
| Minimum 2-m air temperatur | °C |
| Rainfall estimate | mm |
| Relative Humidity | % |
| Wind Speed | ms-1 |
| Surface air pressure at sea level | hPa |
|
Surface downwelling shortwave radiation flux |
W/m² day |
Coverage, spatial and temporal resolution
Period and temporal resolution:
- 1950-01-01 (Wind speed: 1980-01-01) bis 2024-12-31 (radiation: 2024-06-30)
- Daily
Coverage and spatial resolution:
- Europe, over land
- Spatial resolution: 0.25° x 0.25° (and 0.1° x 0.1°), cartesian grid
- Geographic longitude: -40.375°E to 75.375°E (-24.95°E to 45.45°E)
- Geographic latitude: 25.375°N to 75.375°N (25.05°N to 71.45°N)
- Dimension: 201 rows x 464 columns (465 rows x 705 columns)
- Altitude: following terrain (except surface pressure)
Format:
- NetCDF
Data quality
Each of the ECAD data sets has a separate file with uncertainties, which merely originate from the interpolation of the in-situ observations into the grid used. Uncertainties are therefore particularly large in areas and time periods with a low observation density and in areas with particularly strong gradients and differences in neighboring stations, such as in mountainous terrain.
The air pressure data set also shows interpolation artifacts, which were apparently caused by the kriging used, but which are not associated with a higher level of uncertainty. There are also artifacts in the distribution in the precipitation data due to gaps in the station distribution. In particular, the amount of precipitation 0 mm has no uncertainty.
More detailed information on data quality can be found in the references. Navarro, A., et al., 2019 use the ECAD rainfall as an evaluation dataset and point out some shortcomings. Further information can be found on the ECAD web page.
A list of the stations used can be downloaded in txt format for version v31e for the following parameters:
- Mean temperature (.txt)
- Temperature minimum (.txt)
- Temperature maximum (.txt)
- Precipitation (.txt)
- Air pressure (.txt)
- Downwelling shortwave radiative flux in air (.txt)
- Relative Humidiy (.txt)
- Wind Speed (.txt)
Contact
ECA&D Project Team
KNMI, De Bilt, The Netherlands
E-Mail: eca (at) knmi.nlStefan Kern
Universität Hamburg
E-Mail: stefan.kern (at) uni-hamburg.de
References
- ECAD Web Page https://www.ecad.eu/
- Algorithm Theoretical Background Document (ATBD) (pdf, not barrier free)
- Begert, M., et al., 2008, An Automated Homogenization Procedure: Performance Assessment and Application to a large European Climate Dataset, Meteorologische Zeitschrift, 17-5, 663-672.
- Haylock, M.R., et al., 2008, A European daily high-resolution gridded dataset of surface temperature and precipitation. J. Geophys. Res. - Atmosphere, 113, D20119, doi:10.1029/2008JD10201.
- Hofstra, N., et al., 2009, Testing E-OBS European High Resolution Gridded Dataset of Daily Precipitation and Surface Temperature, J. Geophys. Res. - Atmosphere, 114, D21101.
- Van den Besselaar, E.J.M., et al., 2011, A European Daily High-resolution Observational Gridded Data set of Sea Level Pressure, J. Geophys. Res. - Atmosphere, 116, D11110, doi:10.1029/2010JD015468.
- Cornes, R. C., et al., 2018, An ensemble version of the E-OBS temperature and precipitation data sets. J. Geophys. Res. - Atmosphere, 123, 9391-9409, doi: 10.1029/2017JD028200. https://agupubs.onlinelibrary.wiley.com/doi/full/10.1029/2017JD028200
- Navarro, A., et al., 2019, Assessment of IMERG precipitation estimates over Europe. Rem. Sens., 11(21), 2470, doi: 10.3390/rs11212470. https://doi.org/10.3390/rs11212470
Data citation
Please cite the data as follows:
Cornes, R. C., van der Schrier, G., van den Besselaar, E. J. M., and Jones, P. D., 2018, An ensemble version of the E-OBS temperature and precipitation data sets. J. Geophys. Res. - Atmosphere, 123, 9391-9409, doi: 10.1029/2017JD028200.
and the following acknowledgments:
We acknowledge the E-OBS dataset v30.0e from the Copernicus Climate Change Service (C3S, https://surfobs.climate.copernicus.eu) and the data providers in the ECA&D project (https://www.ecad.eu), last accessed: June 17, 2025. Thanks to ICDC, CEN, University of Hamburg for data support.