Polar sea-ice drift vectors from NSIDC
Topics
- Access
- Description
- Parameters
- Coverage, spatial and temporal resolution
- Data quality
- Contact person
- References
- Data citation
Access
UNRESTRICTED:
- Get monthly icemotion data via HTTP (wget shell script to get all data)
- Access monthly icemotion data via OPeNDAP
RESTRICTED: This link to the data set is only available for a restricted user group. The data set is only accessible in CEN/MPI net or accessible from external nets with a customer account. Please contact ICDC if you would like to access this data from outside the network.
- Access daily icemotion data via OPeNDAP
- Data access via file system: /data/icdc/ice_and_snow/nsidc_icedrift
Description
Data of different satellite sensors are combined to obtain a global data set of the sea ice drift, separately for the northern and southern hemisphere, gridded onto a Lambert-Azimuthal Equal Area Grid with 25 km grid resolution.
Because of the limited availability of the satellite data used, the data set is based on a spatially and temporally varying amount of input data.
For the Antarctic, data provided by the Scanning Multichannel Microwave Radiometer (SMMR), the Special Sensor Microwave/Imager (SSM/I) and Imager+Sounder (SSMIS), and the Advanced Very High Resolution Radiometer (AVHRR) are used.
For the Arctic, in addition to the above-mentioned data, data of the Advanced Multichannel Scanning Radiometer (AMSR-E), buoy observations of the International Arctic Buoy Program (IABP), and ice motion derived from NCEP/NCAR surface wind vectors are used.
These are the periods over which the different input data are used:
- AVHRR: 1981-07-24 to 2000-12-31
- SMMR - SSM/I - SSM/IS: 1978-10-21 to 2024-12-31
- AMSR-E: 2002-06-19 to 2011-08-08 (only northern hemisphere)
- IABP buoys: 1979-01-18 to 2024-12-31 (only northern hemisphere)
- NCEP/NCAR: 1979-11-01 to 2024-12-31 (only northern hemisphere)
The documentation on the respective NSIDC web page (see references) informs about the methods used. Compared to version 03 the following changes have been applied to version 04 (the one offered here now):
- All data are provided in netCDF file format (also the input data)
- Merging of drift vectors into the gridded product is not solely based on distance weighing of the 15 closest (to the grid-cell center) drift vectors but weighing is done for the 15 drift vectors with the highest accuracy primarily with distance information being secondary.
- SSM/I input data filtering is enhanced.
- Each buoy provides one daily sea-ice motion instead of twice (0 UTC and 12 UTC) daily.
- No monthly and annual means are offered anymore by NSIDC.
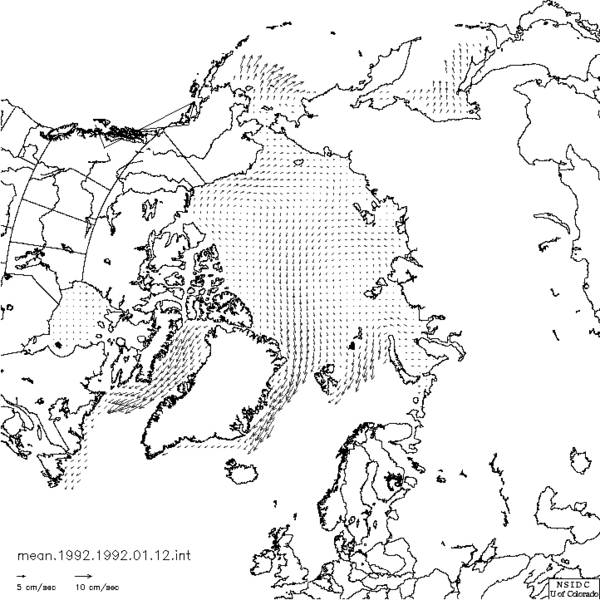
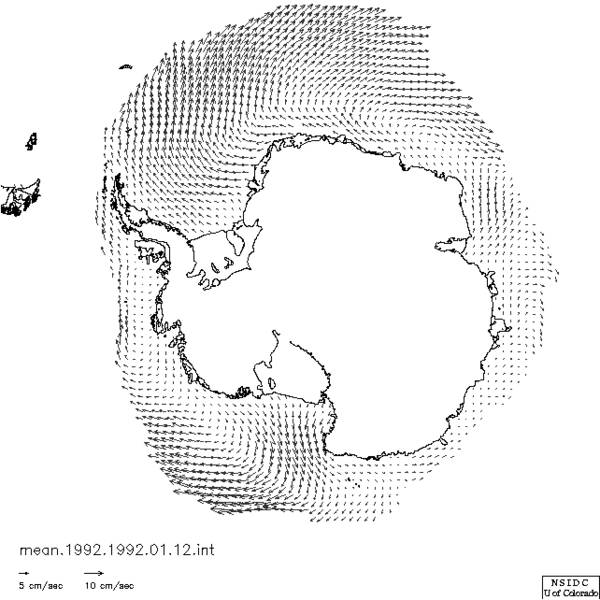
The figure on top of this page shows to sample maps of the mean annual sea ice drift in the Arctic and Antarctic for the year 1992 from product version 03).
ICDC enhanced / modified the data set as follows:
- Translation of the error variable into 3 variables for easier usage
- Computation of the drift velocity
- Computation of the u- and v-component following classical convention (u: positive West to East, v: positive South to North)
- Computation of monthly means (> 10 days with valid daily drift data required)
This is version 4.1 of the NSIDC sea-ice motion data set.
We recommend to register via http://nsidc.org/forms/nsidc-0116_or.html to stay informed about data set modifications.
Last update of data set at ICDC: December 18, 2025
Parameters
| Name | Data set | Unit | Comment |
|---|---|---|---|
| ux | Monthly, Daily | m/s | x-ward velocity in EASE grid |
| vy | Monthly, Daily | m/s | y-ward velocity in EASE grid |
| sdevux | Monthly | m/s | standard deviation of x-ward velocity in EASE grid |
| sdevvy | Monthly | m/s | standard deviation of y-ward velocity in EASE grid |
| u | Monthly, Daily | m/s | eastward velocity |
| v | Monthly, Daily | m/s | northward velocity |
| sdevu | Monthly | m/s | standard deviation of eastward velocity |
| sdevv | Monthly | m/s | standard deviation of northward velocity |
| velocity | Monthly, Daily | m/s | drift velocity from u and v |
| sdev_velocity | Monthly | m/s | standard deviation of drift velocity |
| sigma | Monthly, Daily | m/s | (mean) retrieval error of drift velocity |
| noofdays | Monthly | - | 1 ... 31 (number of days per month with valid data) |
| flag 1 | Daily | - | data very close to coast |
| flag 2 | Daily | - | data interpolated over large distances |
| land | Monthly, Daily | - | land mask |
Coverage, spatial and temporal resolution
Period and temporal resolution:
- 1978-11-01 to 2024-12-31
- Daily and Monthly
Coverage and spatial resolution:
- Northern and Southern hemisphere
- Spatial resolution: 25 km x 25 km, EASE-Grid (see references)
- Geographic longitude: 0°E to 360°E
- Geographic latitude: 48.4°N to 90°N and 53.2°S to 90°S
- Dimensions: 361 columns x 361 rows (Northern hemisphere), 321 columns x 321 rows (Southern hemisphere)
- Altitude: 0.0m
Format:
- NetCDF
Data quality
For each grid cell and each day an error estimate and a quality flag is given.
For a list of missing data we refer to the respective NSIDC web page (see references).
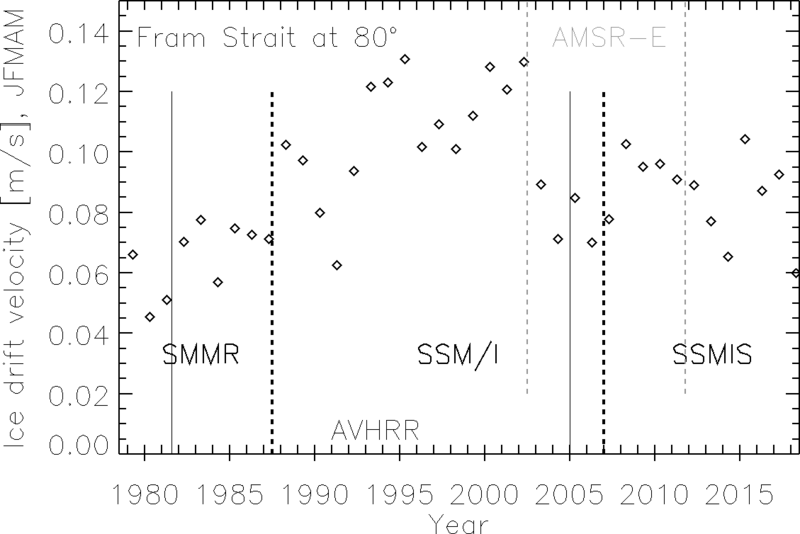
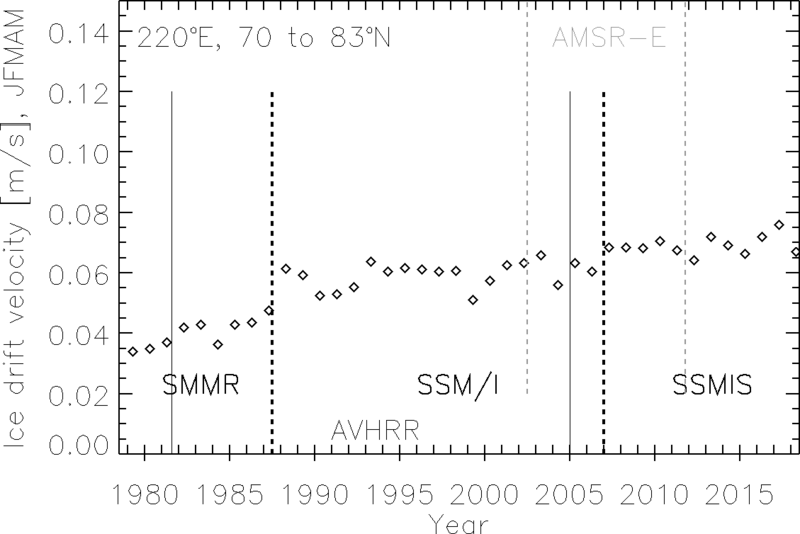
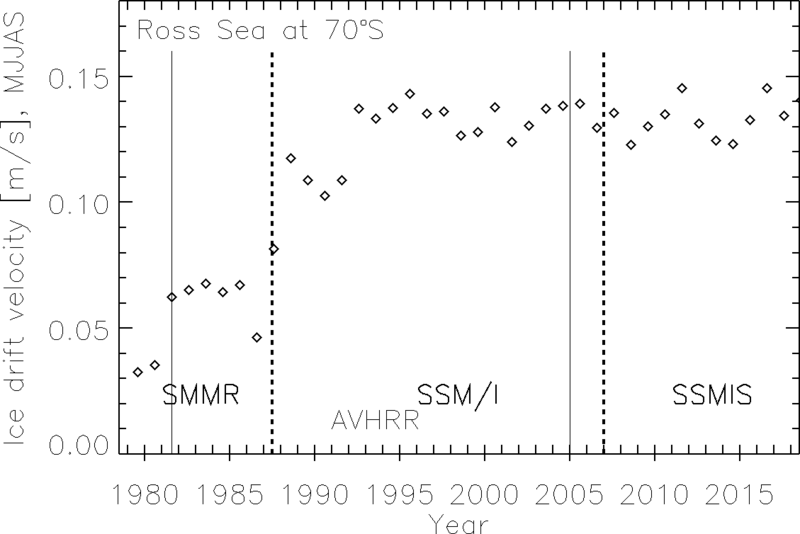
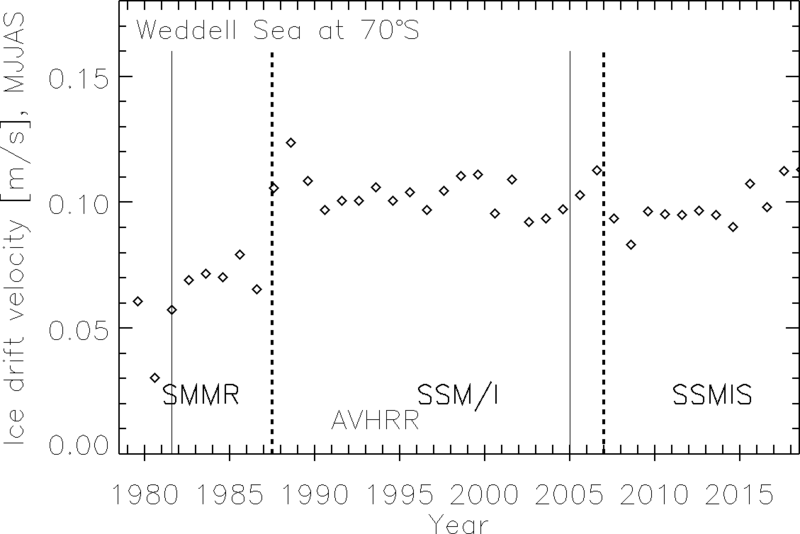
We note that the number of input data sets for the final product varies strongly between the hemispheres. For the Antarctic, the final product relies on two input data sets until the end of 2000; then it solely relies on the SMMR - SSM/I - SSM/IS input data sets. In contrast, for the Arctic, most of the final product relies on three input data sets: buoy motion, NCEP/NCAR, and SMMR - SSM/I - SSM/IS; for 07/1981 to 12/2000 (AVHRR) and for 06/2002 to 08/2011 (AMSR-E) the final product is even based on four input data sets.
Usage of buoy data seems to cause artifacts in the gridded ice motion data (i.e. the daily and monthly mean data we are offering at ICDC). These artifacts can be tracked in the ice drift maps (as local minima or maxima depending on whether the buoy ice drift is higher or lower than the background ice drift) as well as in the maps of the uncertainty (as local minima) - and the additional parameters listed below.
We recommend to pay attention when using the data set for the entire period, i.e. 1978-2018 for, e.g., the computation of trends in sea-ice motion or sea-ice volume fluxes.
The four images illustrate the sea-ice motion averaged along four transects (Arctic: Framstrait at 80°N, and 220°E, 70°N to 83°N. Antarctic: Weddell Sea at 70°S, 20°W at 60°W, and Ross Sea at 70°S, 160°E to 220°E). Averaging periods are January through May (Arctic) and May through September (Antarctic).
Contact
Mark Tschudi
CCAR, University of Colorado
UCB 431, Boulder, CO
email: mark.tschudi (at) colorado.eduWalt Meier
National Snow and Ice Data Centre
University of Colorado / CIRES
email: walt (at) nsidc.orgStefan Kern
Department of Earth System Sciences
University of Hamburg
email: stefan.kern (at) uni-hamburg.de
References
Literature:
- Maslanik, J., et al., Distribution and trends in Arctic sea ice age through spring 2011. Geophys. Res. Lett., 38(L13502), 2011, doi: 10.1029/2011GL047735, https://doi.org/10.1029/2011GL047735
- Tschudi, M. A., et al., Tracking the movement and changing surface characteristics of Arctic sea ice. J. Selected Topics in Earth Obs. Rem. Sens., 3(4), 2010, doi: 10.1109/JSTARS.2010.2048305, https://doi.org/10.1109/JSTARS.2010.2048305
- Haumann, F. A., et al., Sea-ice transport driving Southern Ocean salinity and its recent trends. Nature, 357, 89-107, 2016, doi: 10.1038/nature19101, https://doi.org/10.1038/nature19101
- Olason, E., and D. Notz, Drivers of variability in Arctic sea-ice drift speed. J. Geophys. Res. - Oceans, 119, 5755–5775, doi: 10.1002/2014JC009897, https://doi.org/10.1002/2014JC009897
- Sumata, H., et al., An intercomparison of Arctic ice drift products to deduce uncertainty estimates. J. Geophys. Res. - Oceans, 119, 4887–4921, 2014, doi: 10.1002/2013JC009724, https://doi.org/10.1002/2013JC009724
- Szanyi, S., et al., Persistent artifacts in the NSIDC ice motion data set and their implications for analysis. Geophys. Res. Lett., 43(20), 2016, doi: 10.1002/2016GL069799, https://doi.org/10.1002/2016GL069799
- Zhang, Z., et al., Arctic sea ice volume export through the Fram Strait from combined satellite and model data: 1979-2012. Acta Oceanol. Sin., 36(1), 44-55, 2017, doi: 10.1007/s13131-017-0992-4, https://doi.org/10.1007/s13131-017-0992-4
Websites:
- NSIDC product web page, http://nsidc.org/data/nsidc-0116.html
- EASE-Grid, http://nsidc.org/data/ease/
Data citation
Please cite the data as follows:
Tschudi, M., W. N. Meier, J. S. Stewart, C. Fowler, and J. Maslanik. 2025. Polar Pathfinder Daily 25 km EASE-Grid Sea Ice Motion Vectors, Version 4.1. [Indicate subset used]. Boulder, Colorado USA. NASA National Snow and Ice Data Center Distributed Active Archive Center. https://nsidc.org/data/nsidc-0116. https://doi.org/10.5067/INAWUWO7QH7B. [last access date: December 15, 2025].
For the monthly averages:
Monthly mean sea-ice motion vectors derived from Tschudi, M., W. N. Meier, J. S. Stewart, C. Fowler, and J. Maslanik. 2025. Polar Pathfinder Daily 25 km EASE-Grid Sea Ice Motion Vectors, Version 4.1. Boulder, Colorado USA. NASA National Snow and Ice Data Center Distributed Active Archive Center. doi: https://doi.org/10.5067/INAWUWO7QH7B. [last access date: December 15, 2025] were provided in netCDF format (file version fv0.01) by the Integrated Climate Data Center (ICDC, https://www.cen.uni-hamburg.de/en/icdc) University of Hamburg, Hamburg, Germany.
and with the following acknowledgments:
Thanks to ICDC, CEN, University of Hamburg for data support.
